Three Tricks for Chrome DevTools to Find Logs More Easily


URL copied to clipboard

Chrome's developer tools are incredibly powerful. Unfortunately, both the console and network tab tend to be filled up with a lot of logs which are rarely looked at, making it difficult to find what you are there to look at.
Today I will show you three tricks of how you more easily can find the information you are searching for. You may have seen the first tip before, but the second and third ones are lesser known tricks I rarely see people use or write about.
1. Let Your Logs Stand Out
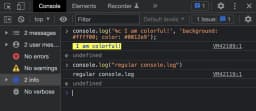
Make your console logs look beautiful like this.

While it easy to notice, it's a bit verbose to write. You can create a JavaScript utility function for it to make it easy to write.
const clog = (log) => console.log(`%c ${log} `, 'background: #ffff00; color: #0012e9');

# Usage
clog("I am colorful!")

Another alternative is to create a snippet in VS Code so VS Code can autocomplete the code for you when you just write a prefix of your choice.
Below you can see two snippets. The first one, with the prefix clog, will output a colorful log statement for you when you write clog in a file and autocomplete it with the tab key. The second one, named vlog, logs out both a label and a value.
{
  "Colored Console": {
    "prefix": "clog",
    "body": [
      "console.log('%c $1 ', 'background: #ffff00; color: #0012e9');",
      "$2"
    ],
    "description": "Log colored message to console"
  },
  "Colored Value Console": {
    "prefix": "vlog",
    "body": [
      "console.log('%c $1 ', 'background: #ffff00; color: #0012e9', $1);",
      "$3"
    ],
    "description": "Log colored message to console and an additional value"
  }
}
2. Group Console Messages
Do you have annoyingly many console messages and don't want to remove them? What if I said you can keep them and still hide them? The solution you search for is console.group. In this way you can for example group logs per file or module. Or maybe wrap all logs used for app initialization in a group.
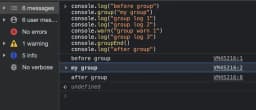
To wrap some logs in a group, simply write console.group() before your logs and console.groupEnd() after the logs. The web console will fold all the logs there in between.

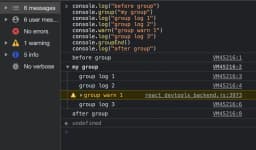
And when you expand the group, it looks like this.

3. Filter Network Requests Instead of Searching
The network tab tends to be very bloated in medium and large sized applications, especially when analytics and log requests are sent remotely. As you might already know, you can filter network requests based on their type, e.g., images or AJAX requests (Fetch/XHR). I would guess you even have found the filter field where you can filter network requests.

I have seen a lot of persons using the filter field to search for the request they want to view, it's an easy way to ignore all other kind of spam requests. The cumbersome thing about that is that you have to write a filter term every time you want to find a new request.
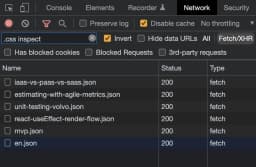
To avoid that, I instead use the filter field to filter out logs I never am interested to see. To do so, just check the invert button beside the filter box and enter the words you don't want to see. Separate each word with a whitespace.
In the example below, all requests including the terms "inspect" and ".css" are filtered out. You can keep this filter active to always have a clean network log showing only requests you commonly look at.


